Maximize Value-Based with Optimize
The Performance Analytics Platform.
Turn RAF activity into real-time, actionable performance intelligence.
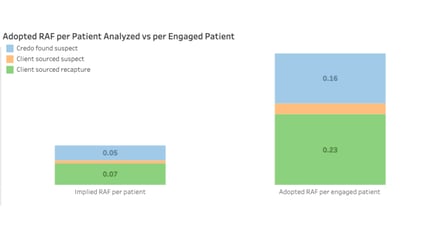
Optimize consolidates value-based care activity into live dashboards for administrators, MSOs, ACOs, and health plans—giving you clear visibility into RAF opportunities, compliance exposure, and provider engagement across populations. Track what codes are generated, actioned, and billed—and see how that activity translates to RAF downline.

Optimize
How It Works
Partners using Credo Health’s Data Insights Agent, Inspect, have access to the Optimize dashboard.
Why use Inspect?
Credo’s Data Insights Agent, Inspect, produces high-fidelity HCC suspects with clear provenance. Partners who use Inspect for data insights can access Optimize for full lifecycle tracking, performance analytics, and 10% + high-risk validation.
The Impact
Actionable, audit-ready performance oversight.
Optimize provides a consolidated view of HCC activity and outcomes, linking provider engagement to billing and reimbursement so leaders can understand where and why codes stall, and steps you can take to improve results across lines of business.
- Track whether suspects are reviewed, accepted/rejected, billed, and reimbursed across populations.
- Reduce clawback risk proactively with 10% + high-risk validation that spots weak submissions earlier.
- Recover well-supported, previously missed RAF (optimize TAF accuracy) by investigating missing codes documented in the record.
- Improve throughput across the lifecycle (Generated → Reimbursed) by exposing chokepoints and trends in provider engagement and acceptance.
- Maintain audit-ready traceability from identification through reimbursement.
Key Benefits.
Want to exceed your value-based care goals?
Credo Health makes it easier to see what’s working—and fix what’s not.
Schedule a call with Credo Health to explore how Optimize can help your organization elevate performance, strengthen RAF defensibility, and improve provider engagement across your populations.
Let’s Talk
Any sample dashboards or metrics are illustrative and based on anonymized partner data and representative configurations. Validation coverage reflects 10% of generated HCCs plus targeted high-risk codes. Actual results and impact will vary by population characteristics, available data sources, and program configuration.